Reports That Actually Help You Make Decisions.
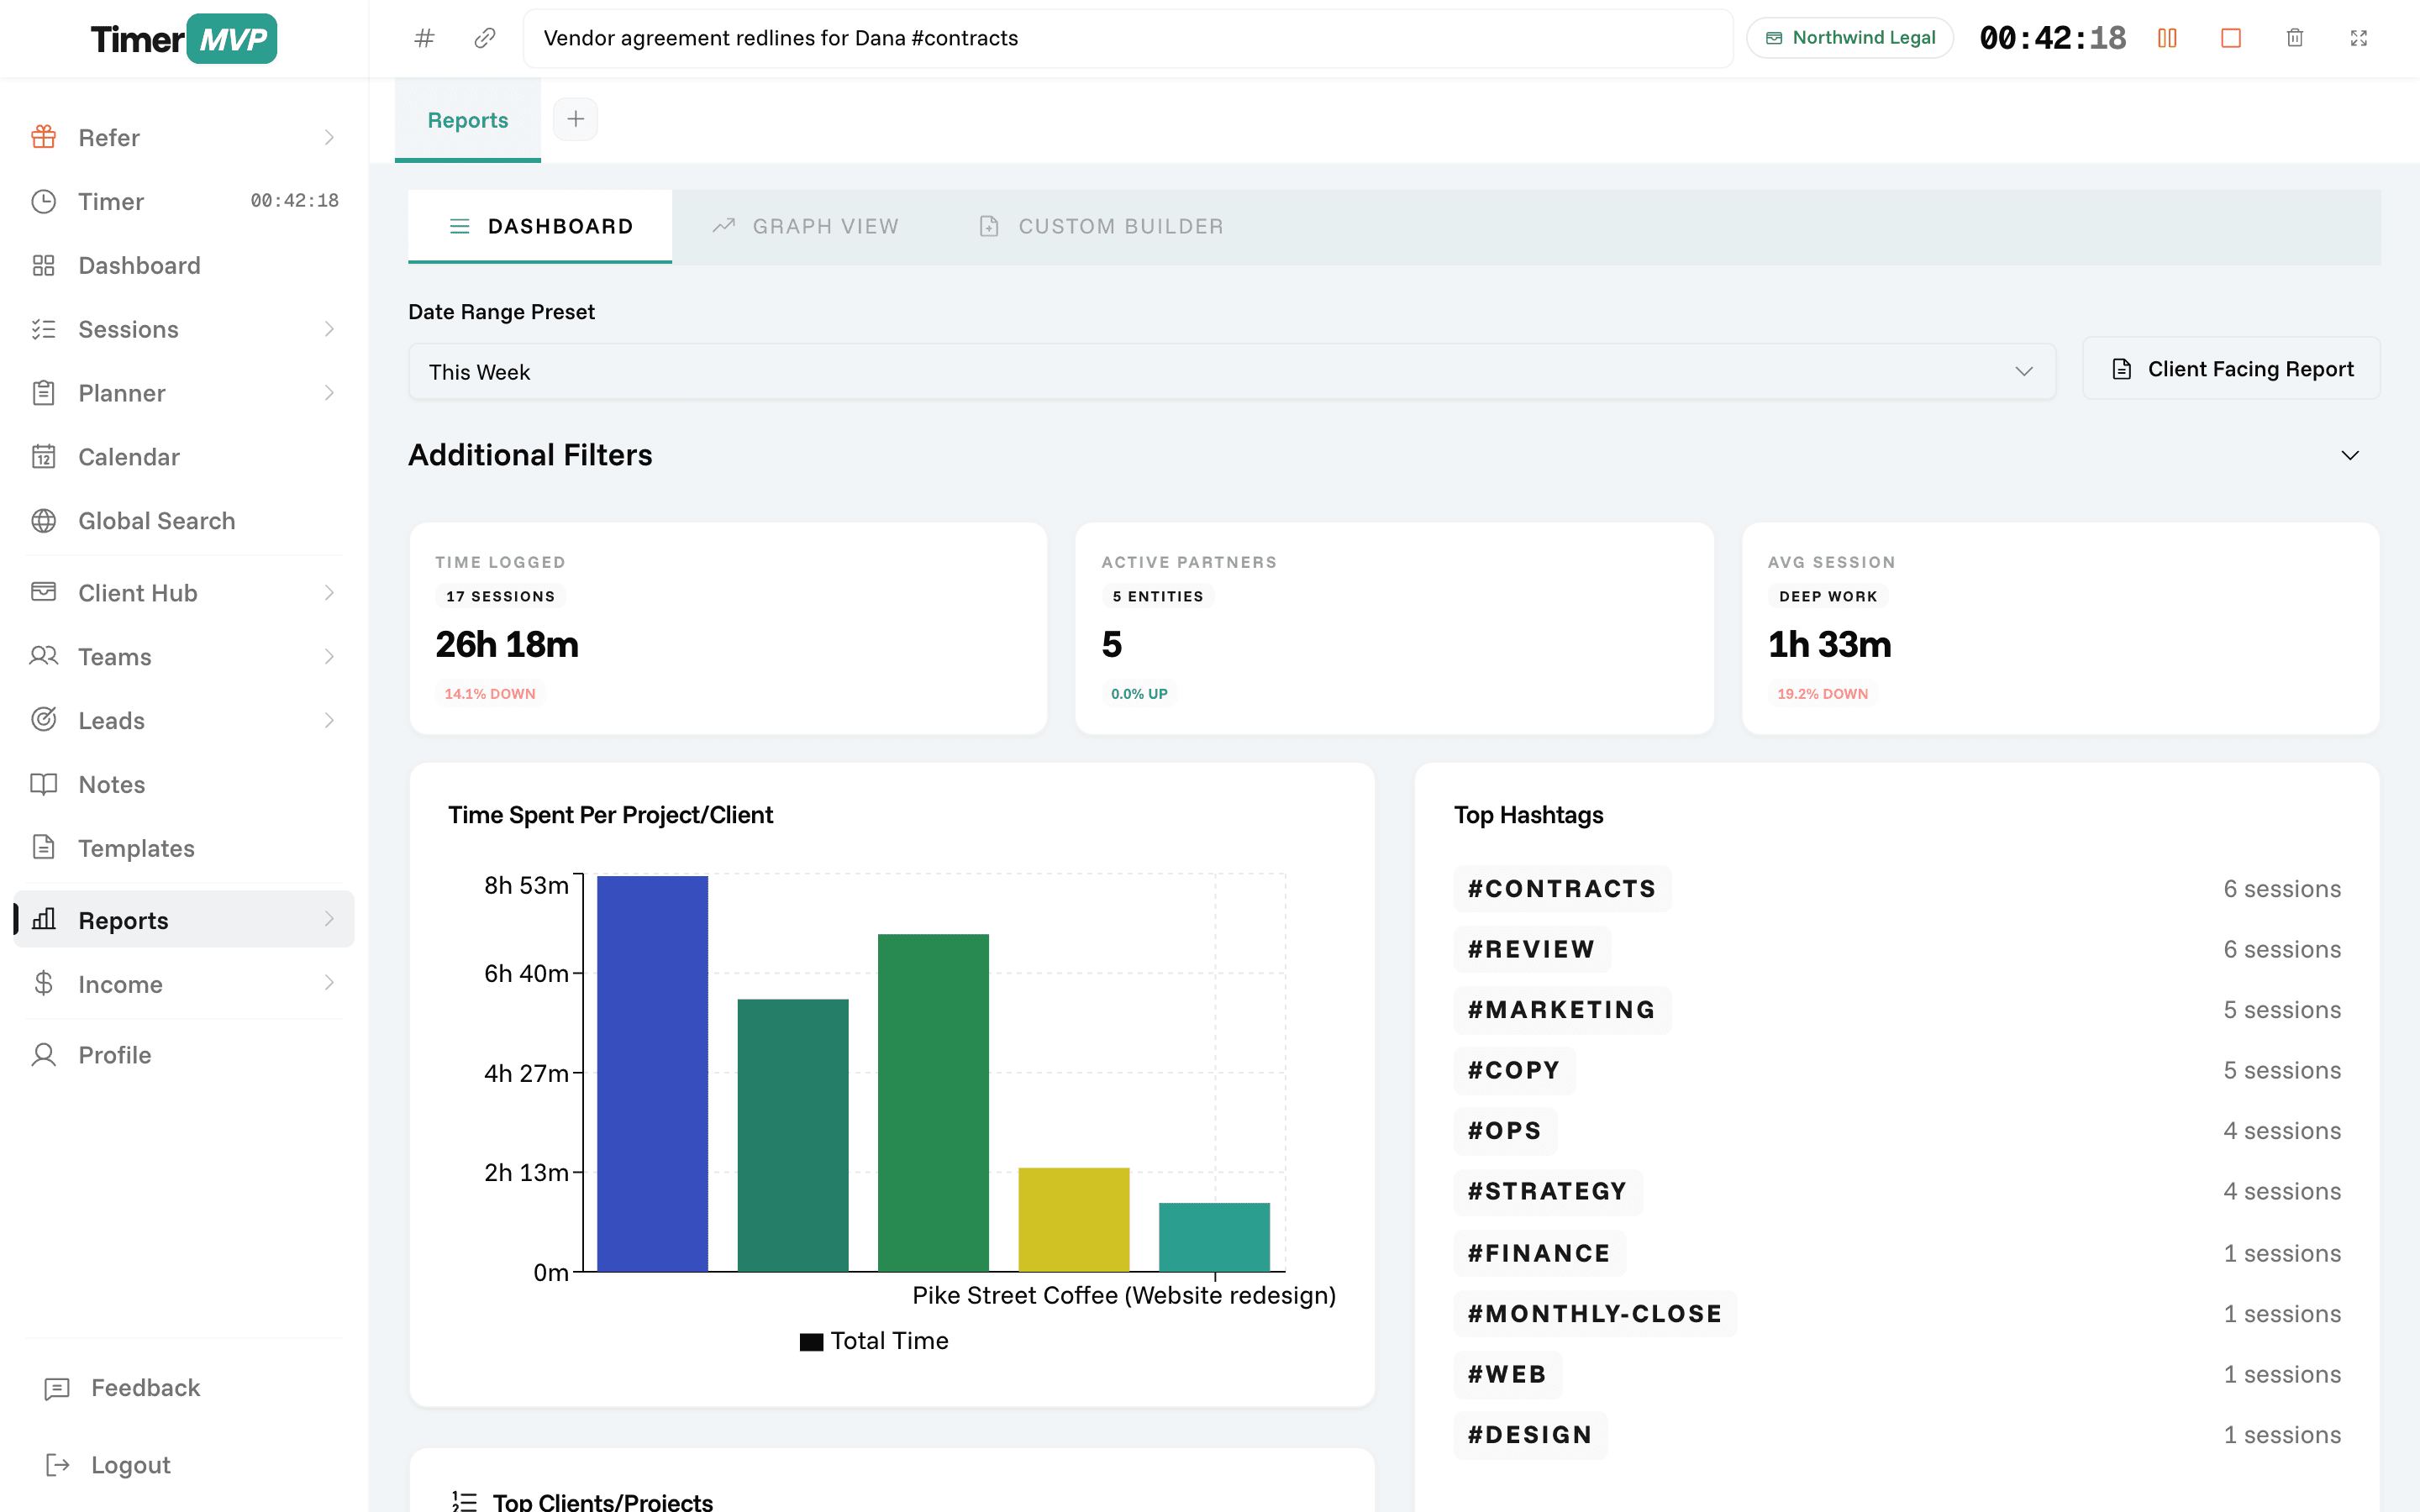
Build dynamic reports with custom filters, grouping, and export to PDF/CSV — see where your time and money really go.
Why Freelancers Love This
Built specifically to solve the headaches of running a freelance business.
Custom Funnel & Grouping Builder
Funnel by client, date range, project, hashtag, or any combination. Group by client, date, or hashtag. No limit to report variations.
PDF & CSV Export
Export reports in professional PDF format for clients or spreadsheet-friendly CSV for further analysis in Excel.
Visual Charts & Breakdowns
See pie charts, bar graphs, and trend lines. Visualize where your time and money are going at a glance.
Precision Engineered
For Growth
Every pixel is designed to help you save time and make more money.
Report Builder
Create custom reports by choosing filters, grouping, date ranges, and visualization style. Save reports for re-running.
Visualizations & Charts
Choose from pie charts, bar graphs, line charts, and tables. See patterns and trends in your data visually.
Export & Sharing
Export reports as PDF for clients or CSV for spreadsheets. Share reports with team members or keep them private.
In depth
Building time and earnings reports that answer real business questions
A report is only useful if it answers a question you actually have. How many hours did this client get last quarter? What share of my time is unbilled? Which days do I do my best work? TimerMVP's custom reports and dashboard turn your sessions into those answers, with filters for the question and PDF or CSV export for whoever needs to see it.
What time tracking reports should a freelancer run every month?
Start with three. Hours and earnings by client, to see who your business really depends on. Billable versus non-billable time, to see how much admin and business development you are carrying. And this month against last month, to see the trend.
Run them on the same day each month so the comparison is fair. In TimerMVP you build each report once with the filters you want, then run it again whenever you need it. Five minutes a month is enough to know your numbers instead of guessing at them.
- Hours and earnings by client
- Billable versus non-billable time
- Month over month comparison
- Hours by hashtag or type of work
How do I send a client a report of hours worked?
Filter a custom report to the client and the billing period, then export it as a PDF. The report lists each session with its date, duration, and notes, which gives the client a clear account of where their money went. It is the simplest way to head off questions about an invoice.
If the client or your bookkeeper prefers a spreadsheet, export CSV instead. The same data opens in Excel, Google Sheets, or accounting software. Because each session carries its own rate snapshot, the totals match what you billed even if your rate changed during the period.
What can the dashboard tell me about my business?
The dashboard is the report you do not have to build. It shows retainer income, your hours compared with last month, how concentrated your income is in your top client, and which clients have gone quiet. A short worth-a-look list surfaces the items that deserve attention this week.
It also shows per-client effective hourly rate and a weekday-by-hour punch card. The punch card is a grid of when you actually work. If most of your tracked hours land after 8pm, or Mondays are always thin, that is information you can plan around.
How do I find out where my non-billable time goes?
Tag it. Use hashtags like #admin, #sales, or #learning on sessions that are not billed to a client, then filter a report by those tags. Most independent professionals find a surprising amount of unpaid time hiding in email, proposals, and tool setup.
The goal is not to eliminate it. Some of that time builds your business. The goal is to see it clearly so you can price for it. If 10 of your 40 weekly hours are unbillable, your billable rate has to cover all 40, and the report makes that math plain.
Frequently Asked Questions
Get Real Insights Into Your Business
Stop guessing where your time goes. Build reports that actually drive business decisions.
No credit card required • Cancel anytime • 30-day free trial